Electoral Reform: Checking the Facts -- Part Two
Introduction: Both sides of the Proportional Representation debate have made claims about what the effects of a ProRep system would be. Here, two Political Science specialists delve into the major claims made about ProRep by both sides. We’ll examine a different claim each week. This week, we look at the claim that ProRep would “keep the Greens and NDP in power indefinitely.”
First, let’s introduce these two:
Dr. Brian Tanguay is a Political Science professor at Wilfrid Laurier University in Waterloo, Ontario. He was the lead author of the Law Commission of Canada’s 200-page 2004 report on electoral reform.
Dr. Dennis Pilon is an Associate Professor at York University in the Department of Political Sciences. His research interests include Elections, Democratic reform, Class analysis, and Canadian/comparative politics.
Their findings are below, taken from the “ProRep Fact Checker” site.
Claim: “This is a way to keep the NDP and Greens in power indefinitely. People need to wake up to that”
Stated by: Andrew Wilkinson, BC Liberal Leader. The Province, June 3, 2018.
Fact Check:
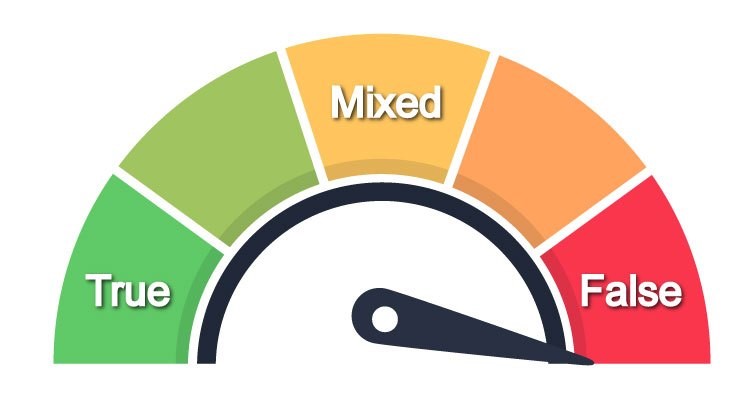
This claim is 100% false.
Proportional representation is used by over 90 countries, including most of the countries in the Organization for Economic and Cooperative Development (OECD). Governments in countries with proportional representation change based on how people vote at election times, with parties on the left, centre and right all having turns in government.
Although the NDP and Greens combined had the support of 57% of BC voters in 2017, for decades parties on the right of the spectrum were supported by a genuine majority of BC voters. There’s no evidence that voter preferences for one particular government will be fixed in place “indefinitely” with proportional representation.
Governments Change with Proportional Representationa
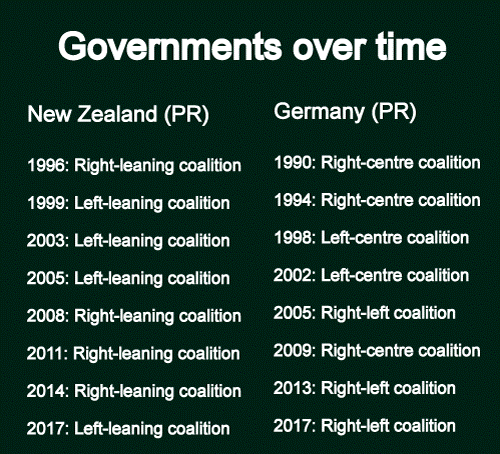
Just like in countries with first-past-the-post, governments change in countries with proportional representation. Proportional representation just means the seats in the legislature will much more closely reflect the popular vote. The picture below is an example of how governments have changed in the past 20 years in two countries that use Mixed Member Proportional Representation (note: New Zealand has elections every 3 years).

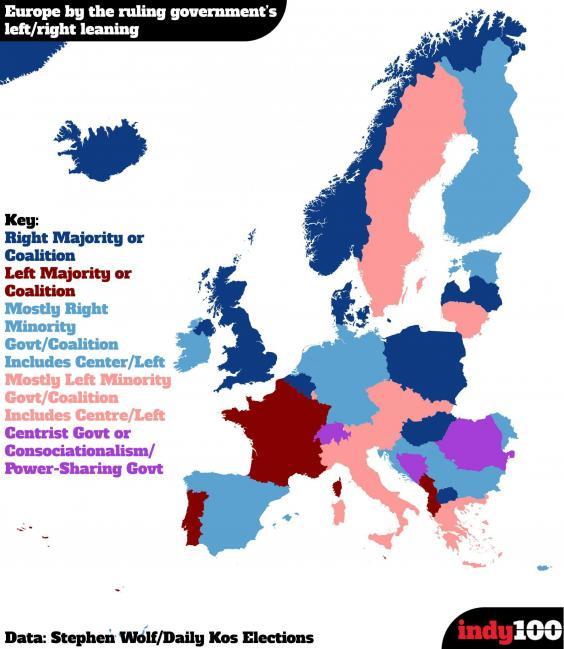
Governments Vary with Proportional Representation
As the image below shows (2016), a variety of governments are in power in Europe, most of which uses proportional representation. (Photo credit: https://www.indy100.com/article/the-map-of-europe-by-how-right-or-left-wing-the-government-is-7332691 )

BC’s History of Voter Preferences
As this record of BC elections since 1903 shows, in almost every election from 1952 to 2005, voters on the right were a genuine majority. There’s no evidence to suggest that the current preferences of BC voters are now fixed “indefinitely”.
[Editor’s Note: The following examples are shown on the chart at the link above. Note that different parties have suffered outcomes that seem unfair, based on their share of the popular vote, at different times — including the Liberal Party of BC:
In 1909, the BC Liberal Party won 33.2% of the vote, and got a total of 2 seats – less than 5% of the seats; the Conservatives won 38 of the Legislature’s 42 seats with 52.3% of the vote.
In 1912, the Liberals fared even worse under FPTP; they won 25.4% of the vote, and got NO seats at all.
In 1941, the Conservatives and the NDP each won 33.4% of the vote, and ended up with 12 and 14 seats respectively; the Liberals got only 32.9% of the vote, won 21 seats and formed government — with the smallest percentage of the vote of the three parties.
In 1991, the NDP won over two-thirds of the seats with only 40.8% of the vote.
In 1996, the NDP again formed government with a majority of the seats – 39 of the 75 seats were won with only 39.5% of the vote – the Liberals had 41.8% of the vote, more than the NDP, but the Liberals got only 33 seats. With ProRep, the Liberals would have had the most seats.]


